Product Updates
Attach Compilations/Table of Contents to a Document Code
If you want to use the DocBoss generated version of the Compilation and/or the TOC for your submission, you must…
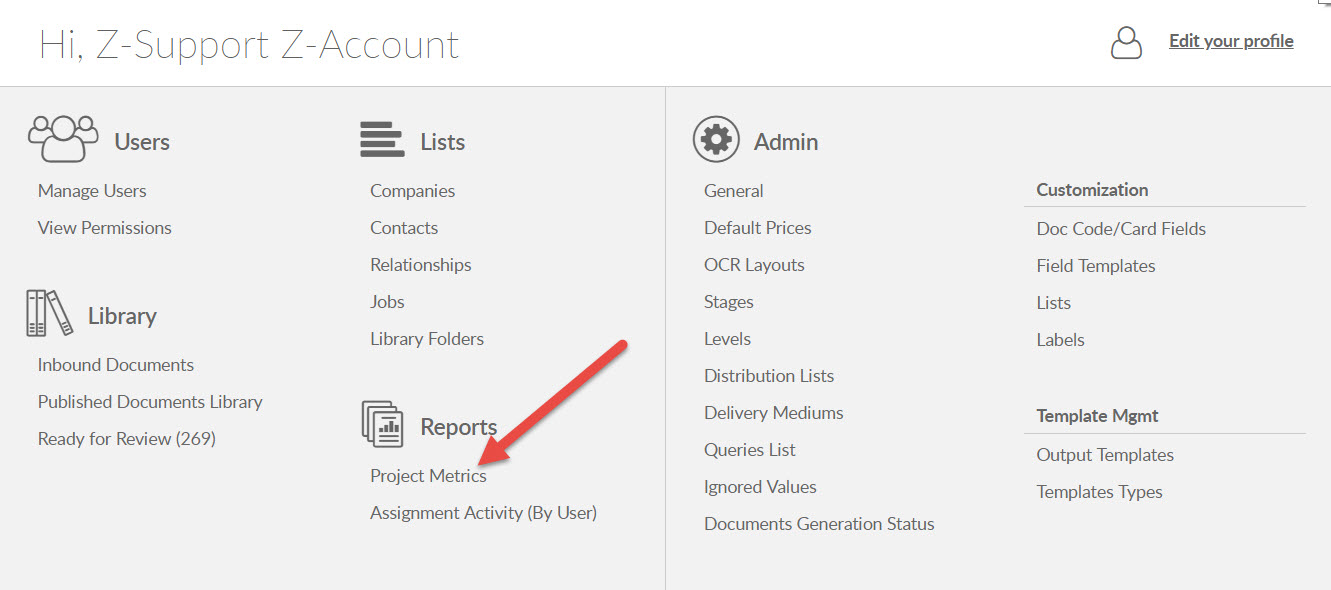
Looking for Internal Reporting? Check out the Metrics Report offered by DocBoss to help keep projects on time and budget:
Settings >Reports > Project Metrics
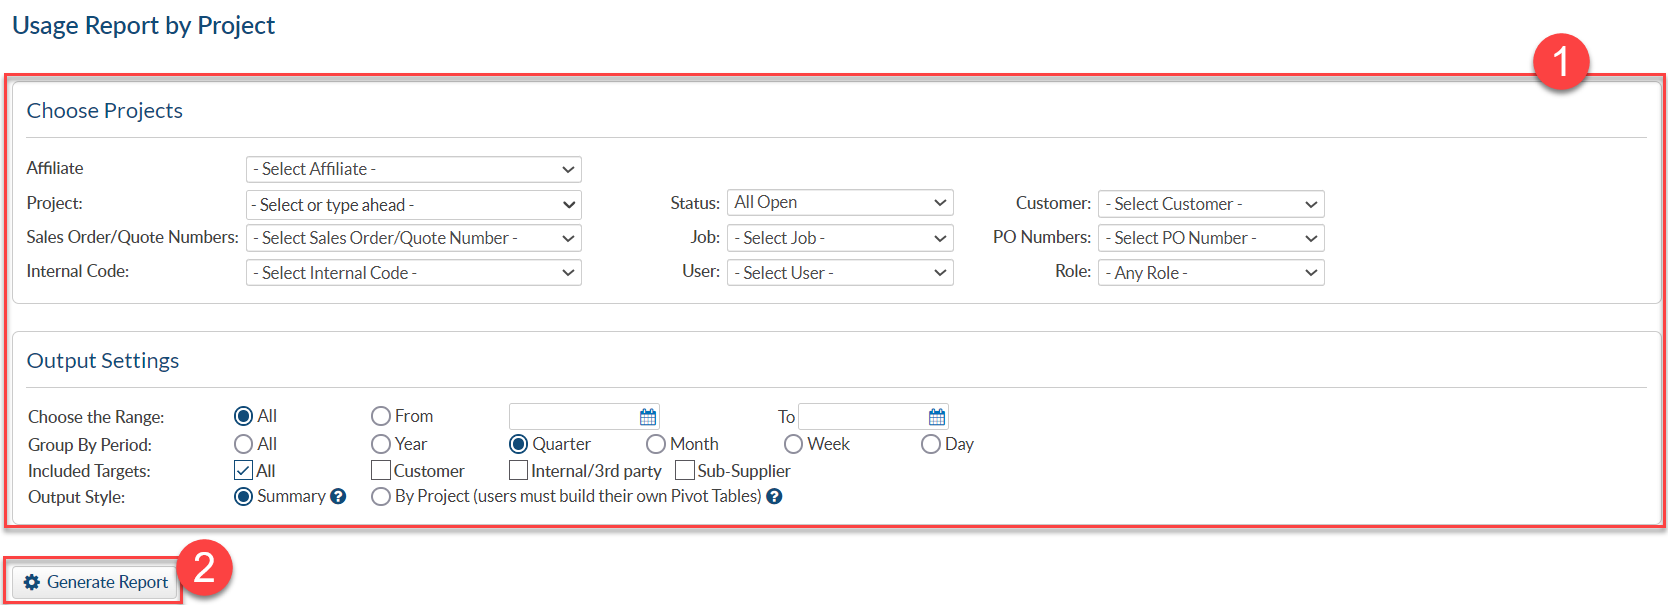
Select the desired filters for Projects and Output settings (1), then Generate report (2).
Choose the Range = The total timeline over which you wish to execute your search.
Group by Period = The results will include an entry for every period over the range.
Included Target = you can choose to limit the results for transactions focused to a specific target. e.g if you choose the customer, only customer transmittals will be included in the analysis.
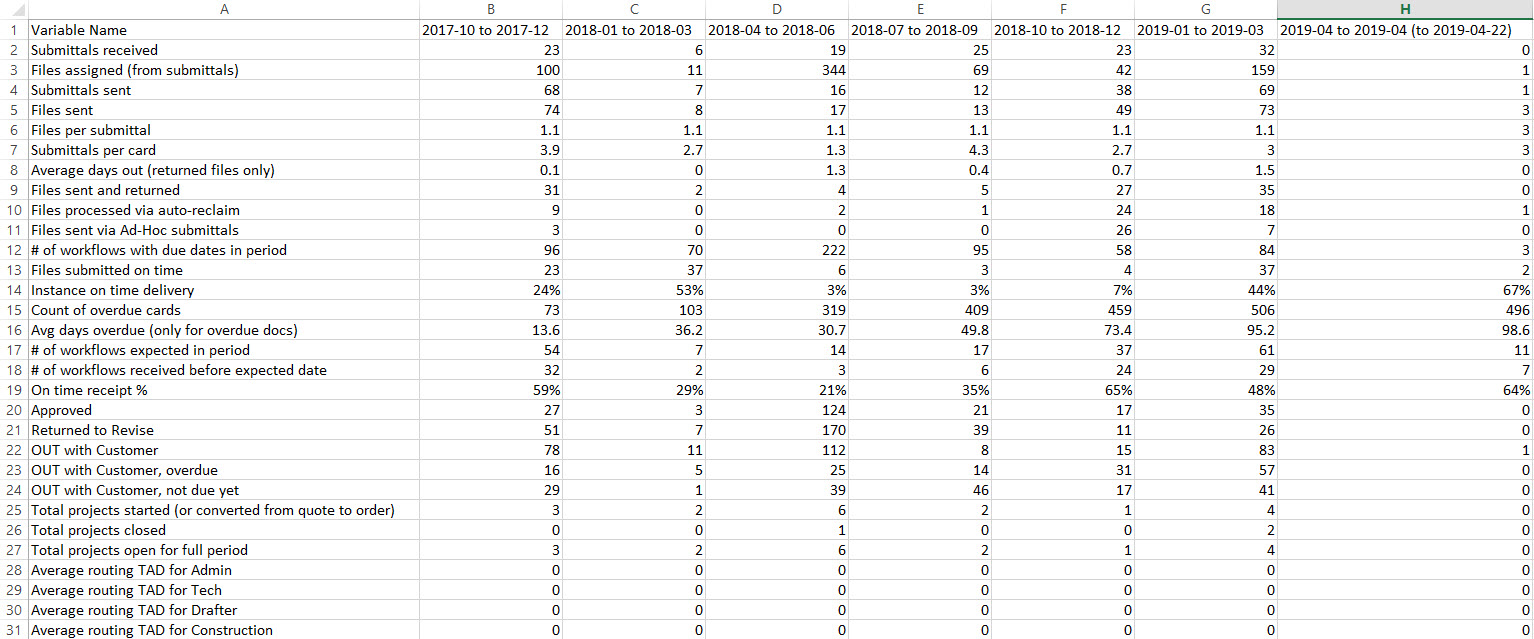
Output Format – Summary:
This output is delivered in a table format. Rows are the parameters, columns are the periods/source.
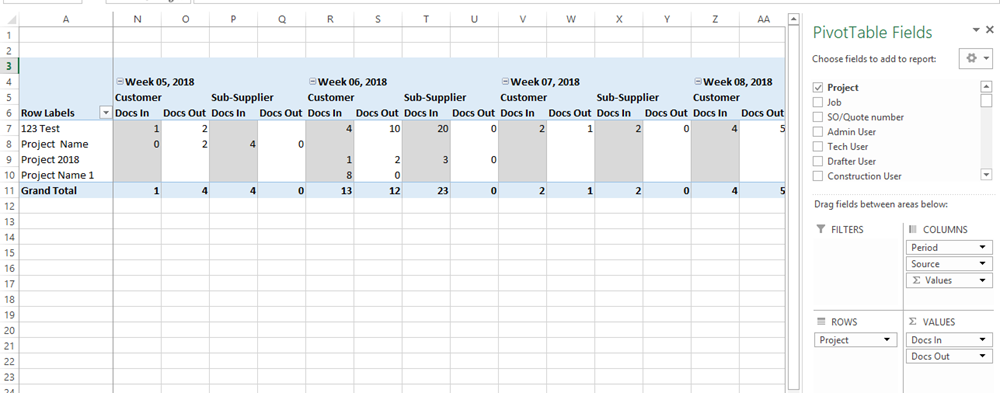
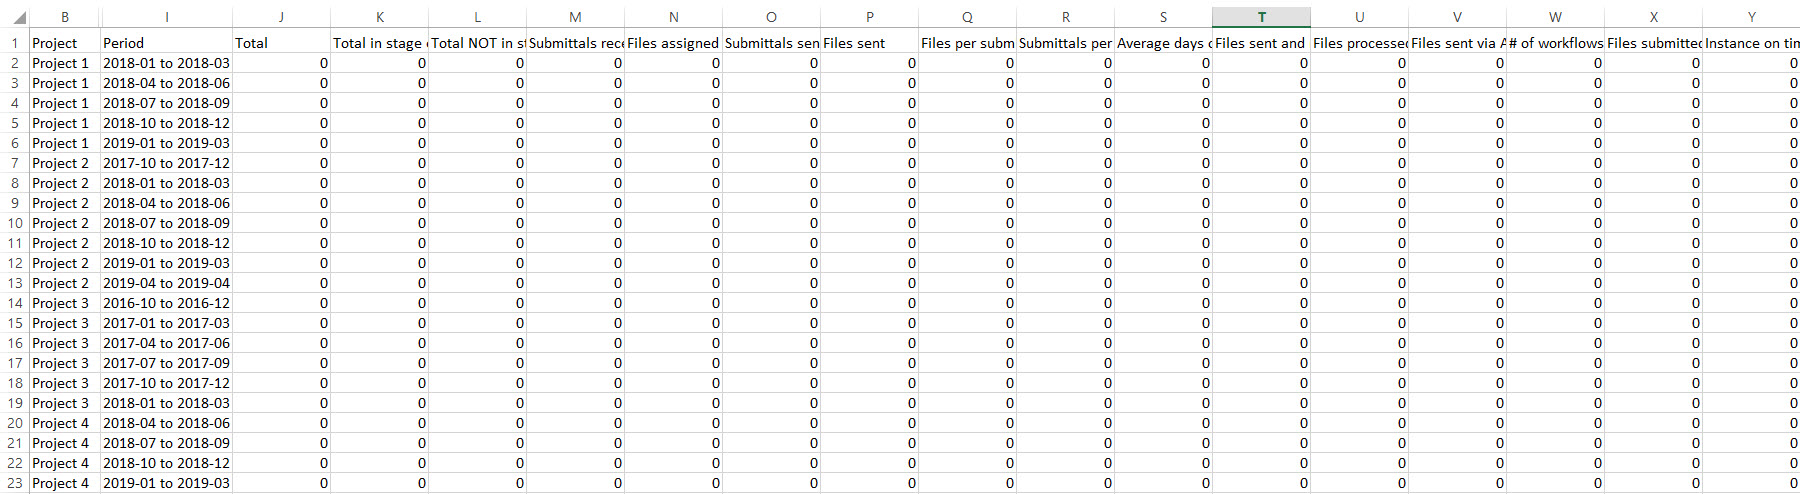
Output Format – By Project
This output contains a separate row for each unique combination of project + period + source. You will have to construct the tables for each project as you wish – generally by building a pivot table (with the parameters as rows, and periods across the top.)
For more on how to create pivot tables, check out this tutorial (NOTE: External content)https://support.office.com/en-us/article/create-a-pivottable-to-analyze-worksheet-data-a9a84538-bfe9-40a9-a8e9-f99134456576
For more detail about the specific fields in the report, click here.
Currently, only one user can execute a search at a time. The results are downloaded in CSV files – but if you open in Excel, you will be able to see the result sets as defined above. We suggest you save the results as Excel files.
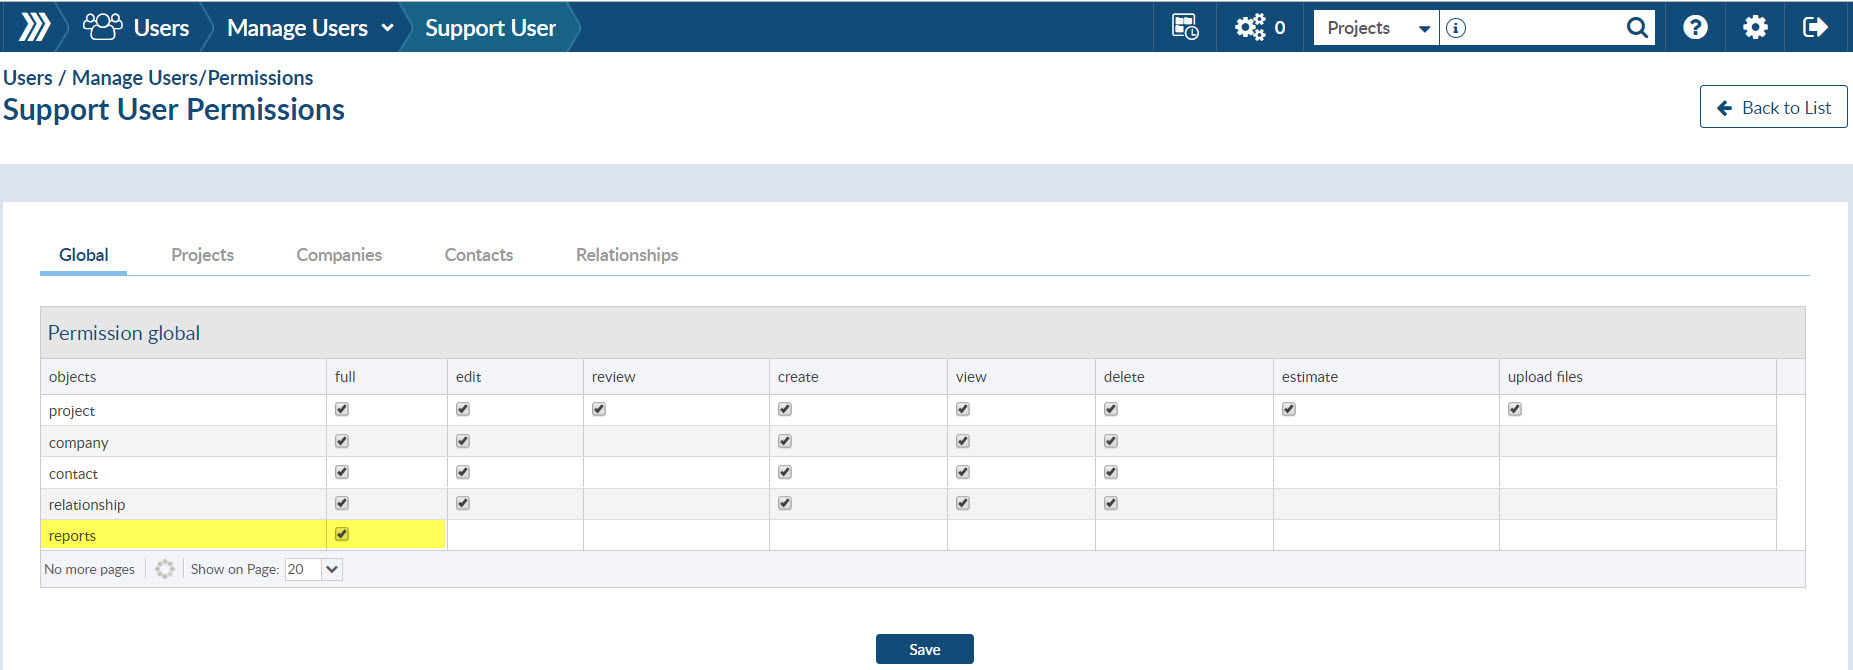
It is permission dependent, so if you don’t see the link, please contact your administrator.


DocBoss is the only true document control system for
suppliers. Book a quick demo to see how we help process
equipment suppliers make more profit with less pain.
If you want to use the DocBoss generated version of the Compilation and/or the TOC for your submission, you must…

One of the great benefits of DocBoss is the template feature which enables you to save commonly used documents to…

Documents can be viewed in DocBoss without having to download them first. To enable the viewer, simply click the viewer…